Table of Contents
A great size chart shows clear, relevant measurements in both centimeters and inches, explains how to measure, makes clear whether numbers are body or garment measurements, and adds fit notes for shoppers between sizes. Place it right next to the size selector, keep it brand and product specific rather than generic, and make it readable on mobile and to screen readers. These practices reduce fit-related returns and give buyers the confidence to order.
Key Takeaways
- Fit and size are consistently the leading reason people return clothing online, so a strong size chart cuts returns, lifts conversion, and builds trust, functioning as a revenue tool that happens to look like a table.
- A great chart includes only the relevant measurements for the garment, shows both centimeters and inches, states clearly whether numbers are body or garment measurements, adds how-to-measure instructions, and gives fit notes for shoppers between sizes.
- Placement matters most: put the chart right next to the size selector (usually as a modal), since a chart buried in the footer or a separate page goes unseen and shoppers guess instead.
- Build it as a real structured table, not a flat image, so it works on mobile and for screen readers, and make it product- and brand-specific rather than one generic store-wide chart.
- For international sales, offer US/UK/EU conversions as columns or a toggle, and always anchor on actual body measurements in cm and inches, since systems and manufacturers vary.
- Different categories need different charts: footwear needs foot length in cm, kids’ sizing needs age and height, and rings need a measurement method rather than just a size label.
- The Product Size Charts for WooCommerce plugin handles per-product chart placement and management without building each one by hand.
A shopper finds a jacket they love, picks their usual size, and it arrives too tight across the shoulders. They return it, lose a little trust in your store, and may not come back. Fit and size are consistently the leading reason people return clothing online, and a weak or missing size chart is often the cause.
This is a best-practices guide, not a how-to. It covers what makes a size chart genuinely useful, where to put it, and the mistakes that quietly drive returns. If you want the build steps for WooCommerce, see how to create a WooCommerce size chart, and for the wider topic of helping customers choose, the ecommerce size guide.
Why size charts matter
A good size chart does three jobs at once, and each one affects revenue.
- It cuts returns. Most fit returns come from guesswork. When a buyer can measure themselves and match the numbers, the wrong size never ships, so you avoid the return shipping, restocking, and lost margin.
- It lifts conversion. Uncertainty about fit is a major reason carts get abandoned. A clear chart removes that doubt at the moment of decision, so more shoppers commit.
- It builds trust. A store that helps you get the size right feels reliable. That confidence brings people back and reduces the hesitation that kills first orders.
A size chart is not a formality. It is a conversion and retention tool that happens to look like a table.
What a great size chart includes
The difference between a chart that helps and one that confuses comes down to a few elements. Include these.
1. Clear, relevant measurements
List only the measurements that matter for the garment. A top needs chest, shoulder, and length; trousers need waist, hip, inseam, and rise. Drop anything irrelevant, since a cluttered chart is harder to read and slower to use.
2. Both centimeters and inches
Shoppers think in different units depending on where they live. Show both centimeters and inches, or give a one-tap toggle. Forcing a customer to convert in their head is friction, and friction loses sales.
3. Body versus garment measurements
State plainly whether the numbers are body measurements (measure yourself, then pick the matching size) or garmentmeasurements (the flat dimensions of the item itself). Mixing the two, or leaving it unstated, is one of the most common reasons a chart misleads. Label it clearly.
4. How-to-measure instructions
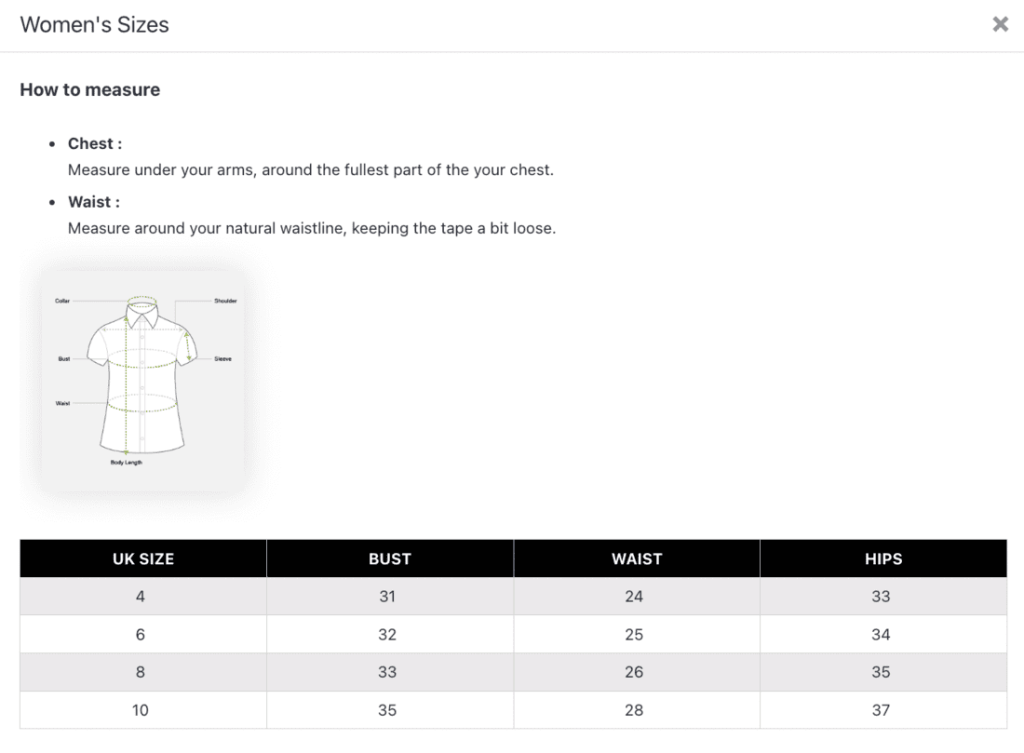
A table of numbers still leaves the question of how to take them. Add short instructions, ideally with a small diagram, showing where to place the tape: around the fullest part of the chest, at the natural waistline, and so on. The chart and the instructions belong together.
5. Fit notes and between-sizes guidance
Numbers do not capture how a garment wears. Add brief fit notes such as “runs small,” “relaxed fit,” or “true to size.” Most usefully, tell shoppers what to do when they fall between sizes, for example “between sizes? size up for a looser fit.” That single line prevents a large share of uncertainty returns.
Where to put it and how
The best chart is useless if no one finds it. Placement and format decide whether shoppers actually use it.
Next to the size selector
Put the size chart link right beside the size dropdown or swatches, where the decision happens. Burying it in the footer or a separate page means most buyers never see it and guess instead.
Modal, tab, or inline
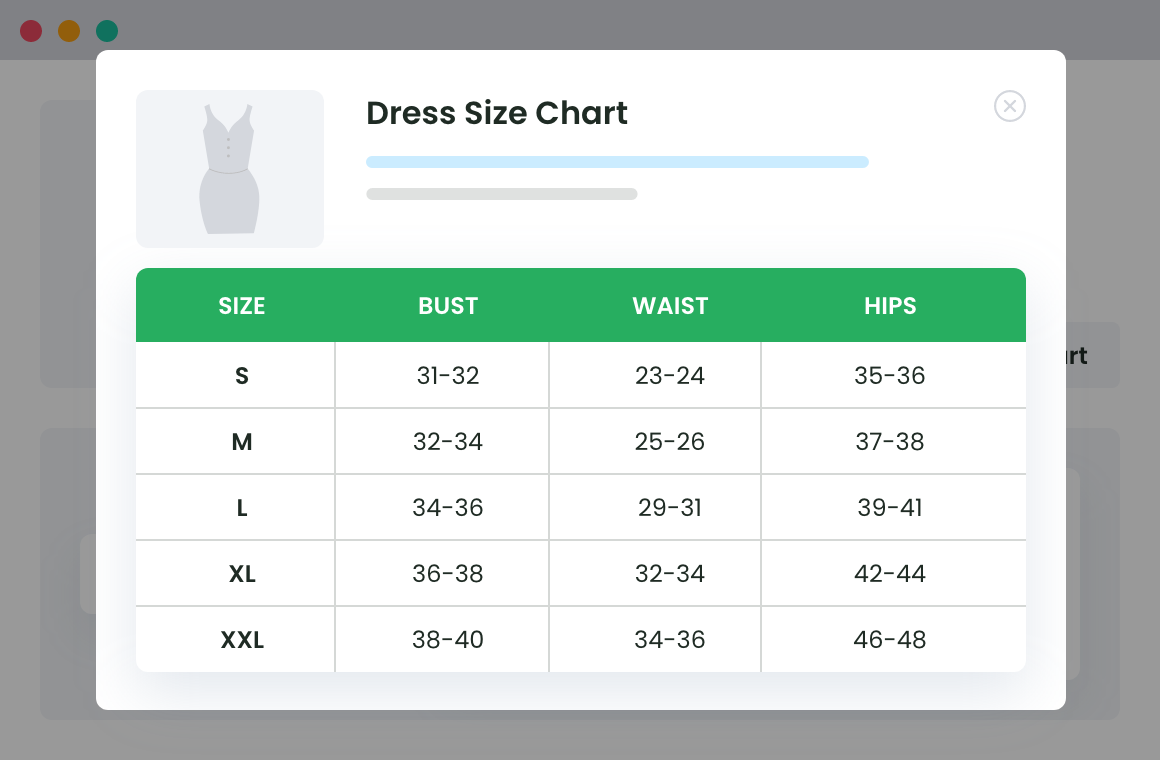
Each format has a tradeoff. A modal popup keeps the shopper on the page and is the most common choice. A product tab works but adds a click and is easy to miss. An inline chart suits simple products but can clutter the page. For most stores, a clean modal triggered next to the size selector is the strongest pattern, and a WooCommerce size chart plugin can place one there without custom code.
Product Size Charts For WooCommerce
Simplify your store experience with customizable size charts that reduce returns and maximize sales.
14-day, no-questions-asked money-back guarantee.
Built for mobile
Most storefront traffic is mobile, so a chart that only works on desktop fails for the majority. Make tables scroll or stack cleanly on small screens, keep text legible, and make the trigger easy to tap. Test it on a phone, not just a laptop.
Accessible, not trapped in an image
A size chart saved as a single flat image cannot be read by screen readers, does not scale on mobile, and cannot offer a unit toggle. Use a real, structured table with proper headings, and add alt text to any diagrams. Accessibility is both the right thing to do and better for everyone on a small screen.
Make it accurate and specific
Generic size charts are worse than none, because they promise precision they do not deliver. The fix is specificity.
Use brand and product specific charts rather than one chart for the whole store. Cuts and fits vary between a fitted shirt and an oversized hoodie, so the same “medium” is not the same across products. Where a product line has its own measurements, give it its own chart.
Keep charts accurate per product and current. When you change a supplier or a cut, update the chart. An outdated chart that no longer matches the garment generates the exact returns it was meant to prevent. For stores with many products, managing per-product charts is far easier with a dedicated product size charts plugin than by hand.
Handle international sizing
If you sell across borders, a single national sizing system confuses half your buyers. Sizes genuinely differ between regions: a women’s size runs several numbers higher in the UK than the US, EU sizing often follows a different basis entirely, and footwear and kids’ sizing diverge again.
Offer conversions, either as extra columns (US, UK, EU) or a region toggle, so a shopper sees their own system. Pair it with the actual body measurements in cm and inches, since measurements are the universal fallback when conversion tables disagree. Even within one system manufacturers vary, so anchor the chart on real measurements, not labels.
Category-specific guidance
Different products need different charts, and treating them all like apparel is a common mistake.
- Apparel: body or garment measurements with clear fit notes, as above.
- Footwear: give foot length in cm alongside size labels, since shoe sizing varies wildly by brand and region. A length-to-measure guide beats a number alone.
- Kids: size by age range and height, and state both, because children of the same age vary in size.
- Rings and accessories: provide a measurement method (a printable ring sizer, or how to measure an existing ring) rather than only a size label.
Match the chart to how customers actually judge fit for that product type.
Add visual aids and interactive help
Beyond the table, a few additions raise fit confidence further.
A measurement diagram shows exactly where each number is taken, removing guesswork. Live model details, listing the model’s measurements and the size they wear, give a real-world reference point. For larger catalogs, an interactive size finder that recommends a size from a few inputs can reduce uncertainty further, though it should support the chart, not replace the underlying measurements. Use these where they earn their place, not as decoration.
Common mistakes to avoid
Most poor size charts share the same handful of flaws. Avoid these.
- A generic, store-wide chart that does not match the actual product.
- One unit only, forcing shoppers to convert in their head.
- No how-to-measure guidance, leaving the numbers ambiguous.
- The chart saved as a flat image, unreadable on mobile and to screen readers.
- Outdated measurements that no longer match the current garment.
- Clutter, with irrelevant rows that bury the measurements that matter.
Conclusion
A size chart is one of the highest-leverage pieces of content on a product page. Get it right and you cut fit returns, lift conversion, and earn the trust that brings buyers back. The principles are simple: relevant measurements in both units, clear how-to-measure guidance, body-versus-garment labels, fit notes, placement next to the size selector, and a mobile-friendly, product-specific chart. When you are ready to put per-product charts on a WooCommerce store without building each one by hand, the Product Size Charts for WooCommerce plugin handles placement and management so you can focus on the measurements.
Product Size Charts For WooCommerce
Simplify your store experience with customizable size charts that reduce returns and maximize sales.
14-day, no-questions-asked money-back guarantee.
Frequently asked questions
What should a size chart include?
Relevant measurements for the garment in both centimeters and inches, a note on whether they are body or garment measurements, how-to-measure instructions, and fit notes including what to do when between sizes.
Should a size chart show body or garment measurements?
Either works, but you must state which clearly. Body measurements tell shoppers to measure themselves and match a size; garment measurements give the flat dimensions of the item. Mixing them without labels causes wrong orders.
Should size charts use inches or centimeters?
Both. Show both units or give a toggle, so shoppers never have to convert. Measurements are also the most reliable basis for international buyers.
Where should the size chart go on the product page?
Right next to the size selector, usually as a modal popup, so it is visible at the moment the customer chooses a size rather than hidden in a separate page.
How do size charts reduce returns?
They replace guesswork with measurement. When a buyer can match their own measurements to a size and read fit notes, the wrong size is far less likely to ship, which is the main driver of apparel returns.
How do I handle international sizing?
Offer US, UK, and EU conversions as columns or a region toggle, and always include the underlying measurements in cm and inches as the universal reference, since systems and manufacturers vary.
Learn More:

📏 Offer Clear Size Guides to Improve Customer Satisfaction
Try the plugin 100% risk free!