Table of Contents
We’ve rounded up the latest, reliable WooCommerce statistics covering platform adoption, number of stores/websites, market share, growth, revenue, ecosystem size, geography, merchant benchmarks, and ecommerce trends.

Last updated: September 2026. All figures were checked against the primary sources linked throughout.
Since its launch in 2011, WooCommerce has grown into the largest open-source ecommerce platform in the world. It powers millions of websites for small, mid, and enterprise-level businesses across a wide range of niches.
In spite of its reach and capabilities, recent headlines about WooCommerce have been a mixed bag.
Stiff competition from Shopify and BigCommerce, the rise of AI-powered website-building platforms, and various other factors have raised concerns about where the platform is heading.
So, where does WooCommerce actually stand in 2026, and what do the latest WooCommerce statistics tell us about its market share, growth, usage, and trends?
At Dotstore, we’re a leading ecommerce software development company that develops both WooCommerce plugins and Shopify apps, we frequently think about questions like:
- How many websites use WooCommerce?
- What is WooCommerce’s market share in 2026?
- Is WooCommerce still growing?
- How does WooCommerce compare with Shopify and BigCommerce?
- Which countries and industries use WooCommerce the most?
- What are the biggest WooCommerce trends in 2026?
…and many more.
So I went down the rabbit hole. I combed through several sources to find the numbers behind the platform and see what they tell us about the current state of WooCommerce.
Below, I’ve compiled 100+ WooCommerce statistics that cover usage, market share, growth, revenue, countries, industries, themes, ecosystem size, and more.
Because WooCommerce is part of a larger ecosystem of ecommerce platforms, I also researched how WooCommerce compares to the other key players: Shopify and BigCommerce.
More than just compiling stats and looking at a long list of numbers, the goal of this research report is to put those numbers into context.
Altogether, this data gives us in-depth insights into where WooCommerce is today, how its usage is changing, and the future.
Want detailed insights into your own WooCommerce statistics? The Dotstore Enhanced Ecommerce Google Analytics for WooCommerce plugin makes it easier to track your store’s most important ecommerce events in Google Analytics. You can monitor product views, add-to-cart activity, checkout behavior, purchases, refunds, and more to understand your customers’ journey and spot opportunities to improve your store’s performance.
WooCommerce Product Enhancements Plugins
Turn Shoppers into Loyal Customers with Product Enhancements
14-day, no-questions-asked money-back guarantee.

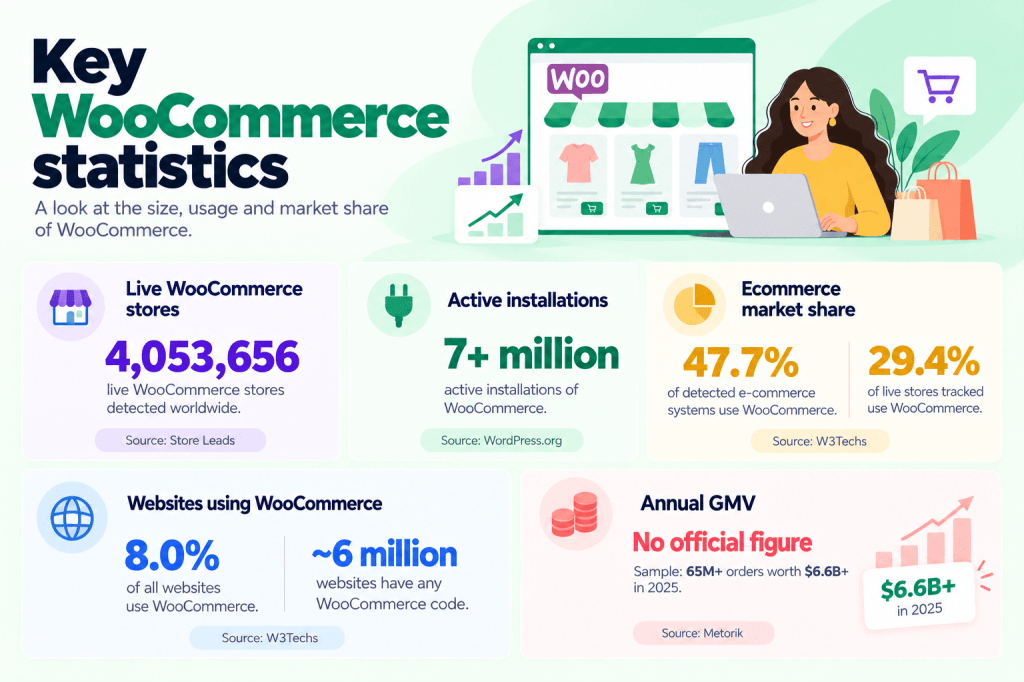
Key WooCommerce stats at a glance
Note: As explained below, data may vary due to each source’s methodology.
| Parameter | WooCommerce statistic | Source |
| Live WooCommerce stores | 4,053,656 | Store Leads |
| Active installations | 7+ million | WordPress.org |
| Ecommerce market share | 47.7% of detected e-commerce systems; 29.4% of live stores tracked | W3Techs |
| Websites using WooCommerce | 8.0% of all websites; about 6 million with any WooCommerce code | W3Techs |
| Annual GMV | No official figure. Sample: 65M+ orders worth $6.6B+ in 2025 | Metorik |
Why WooCommerce statistics vary by source
I scoured data from ten main sources to compile this report. As I started combing through the data, it became increasingly clear that WooCommerce statistics vary quite a bit depending on the source and methodology used.
The upside is that because each source measures WooCommerce differently, combining data points across sources gives us multiple perspectives on its footprint.
| Source | What it tracks |
| WordPress.org | Active WooCommerce plugin installations. |
| BuiltWith | Websites where WooCommerce technology is detected. |
| Store Leads | Live WooCommerce stores. |
| W3Techs | WooCommerce’s technology usage and market share. |
| Metorik | WooCommerce sales, order, merchant, and store-performance benchmarks. |
| Shopify, SEC filings / Shopify 10-Q | Shopify reported sales volume, GMV, performance and checkout-related benchmarks. |
| WooCommerce Newsroom | WooCommerce ecosystem size and community. |
| ThemeForest | WooCommerce themes and templates. |
Throughout this report, I made it a point to find and quote multiple sources for important claims whenever the data is available. In situations where two sources measure different things, I’ll call that out rather than presenting the figures as though they are directly interchangeable.
WooCommerce stats 2026: usage, market share, growth, etc
WooCommerce usage statistics
So, how many sites use WooCommerce in 2026? The answer depends on whether you’re measuring installations, websites with detectable WooCommerce technology, or live ecommerce stores.
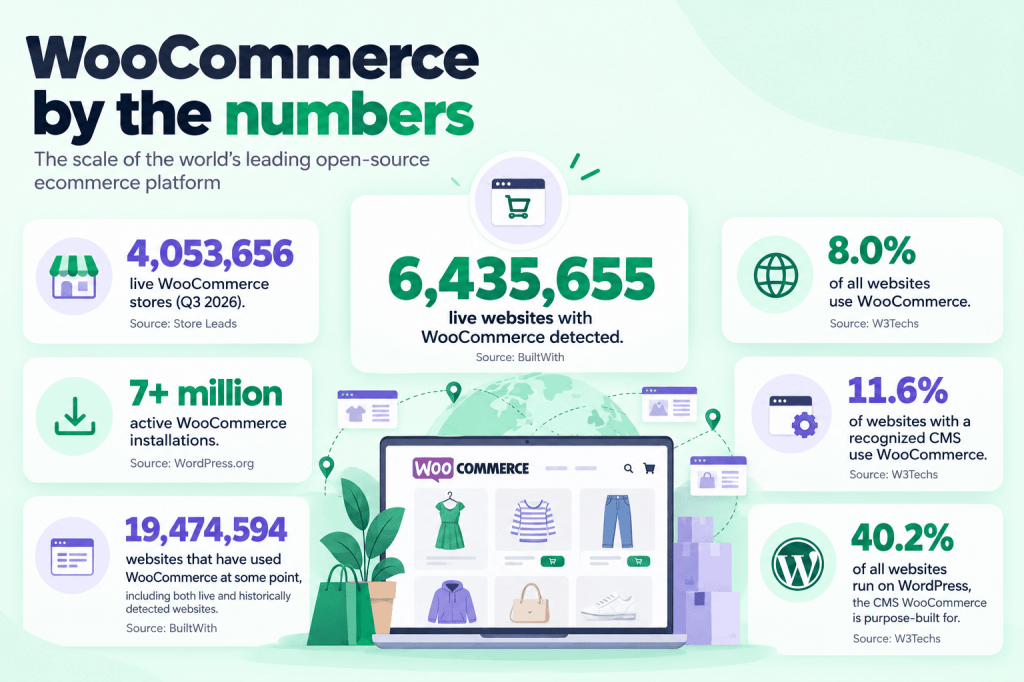
Here are the key headlines measuring WooCommerce usage statistics:
- 6,435,655 live websites currently have WooCommerce detected. [BuiltWith]
- As of Q3 2026, WooCommerce is running on 4,053,656 live stores. [Store Leads]
- There are 7+ million active WooCommerce installations. [WordPress.org]
- 19,474,594 websites have used WooCommerce at some point, including both live and historically detected websites. [BuiltWith]
- WooCommerce powers 8.0% of all websites. [W3Techs]
- It accounts for 11.6% of websites with a recognized CMS. [W3Techs]
- 40.2% of all websites run on WordPress, the CMS WooCommerce is purpose-built for. [W3Techs]
The numbers for live websites and live stores seem far apart because they are measuring different things.
BuiltWith counts websites where it can detect WooCommerce technology, whether or not it is an active ecommerce storefront. Store Leads focuses on live stores with a working catalog; hence, the smaller figure.
W3Techs analyzes websites’ technology stack to measure the percentage of websites using WooCommerce. On the other hand, WordPress.org shows active WooCommerce installations (this includes sites in development mode, so it may not be detected by live website trackers).
WooCommerce store growth statistics
From its initial launch in 2011 until 2020, WooCommerce grew slowly. However, between Q1 2020 and Q3 2026, WooCommerce’s store count has increased at an astonishing rate — about 2.83×.
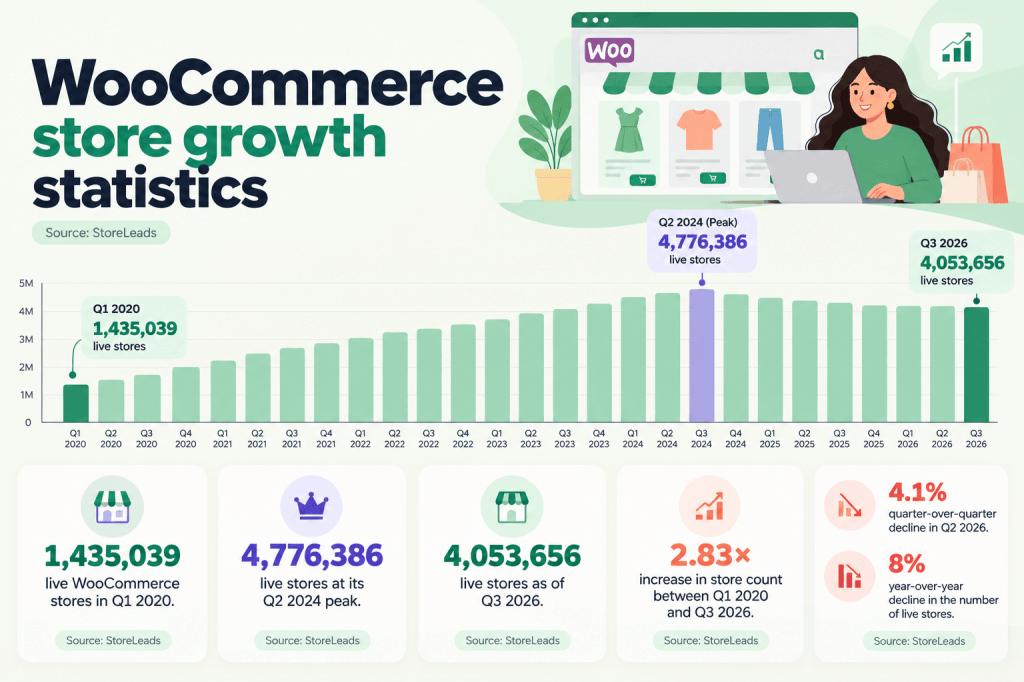
Here’s a quick rundown of the key numbers [StoreLeads]:
- There were 1,435,039 live WooCommerce stores in Q1 2020.
- WooCommerce recorded 4,776,386 live stores at its Q2 2024 peak.
- As of Q3 2026, there are 4,053,656 live stores.
- Q2 2026 marks a 4.1% quarter-over-quarter decline and an 8% year-over-year decline in the number of live stores.
The numbers show a clear decline in WooCommerce’s store count. However, the plateau doesn’t necessarily mean that fewer merchants are adopting WooCommerce.
The likely explanation is that WooCommerce has entered its “mature” phase. No longer the upstart, the current number of live stores reflects both new store creation and stores leaving the platform.
Stores close, switch platforms, or stop being classified as live. Although it has leveled off from its Q2 2024 peak, new stores continue to launch.
WooCommerce market share statistics
Analyzing WooCommerce market share statistics alongside migration data paints a more complete picture of the platform’s position in 2026.
WooCommerce’s overall market share remains substantial. However, its recent migration balance shows considerable movement in both directions, with more stores leaving than joining.
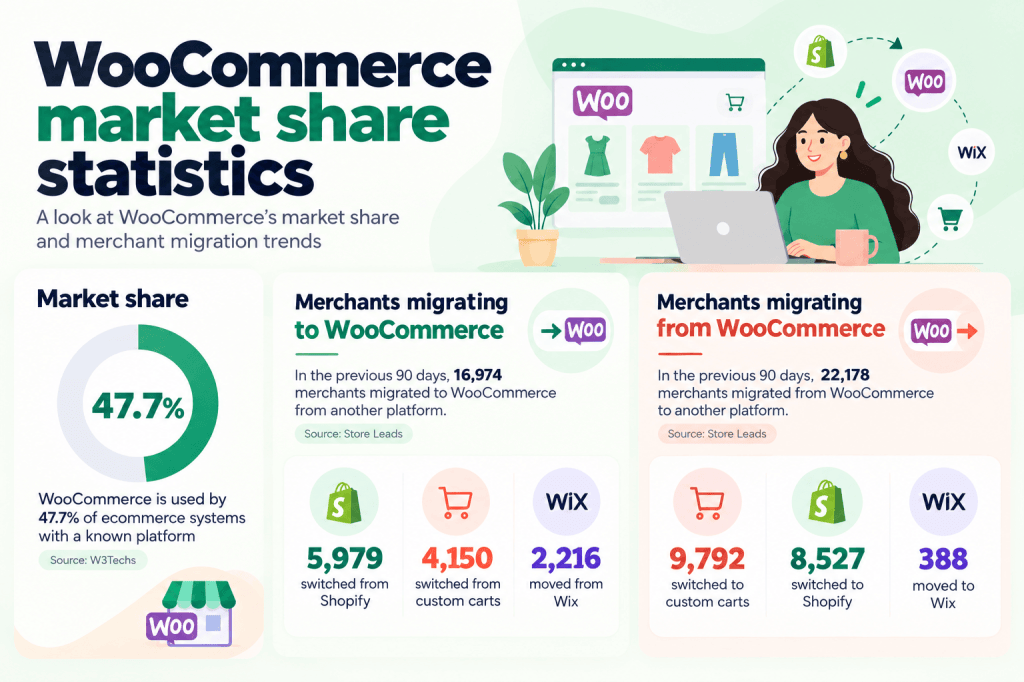
Here are the key numbers to know:
- WooCommerce is used by 47.7% of ecommerce systems with a known platform [W3Techs].
- In the previous 90 days, 16,974 merchants migrated to WooCommerce from another platform [Store Leads].
- Of the 16,974 merchants, 5,979 switched from Shopify, 4,150 switched from custom carts, and 2,216 moved from Wix [Store Leads].
- In the previous 90 days, 22,178 merchants migrated from WooCommerce to another platform [Store Leads].
- Of the 22,178 merchants, 9,792 switched to custom carts, 8,527 switched to Shopify, and 388 moved to Wix [Store Leads].
Although the data shows the direction of platform migrations, it doesn’t tell us why individual merchants changed platforms. Stores move for various reasons: pricing, functionality, maintenance requirements, checkout needs, changes in business strategy, etc.
WooCommerce statistics by country
WooCommerce powers ecommerce websites in 100+ countries/territories worldwide. Despite its global footprint, the United States accounts for the largest share of stores.
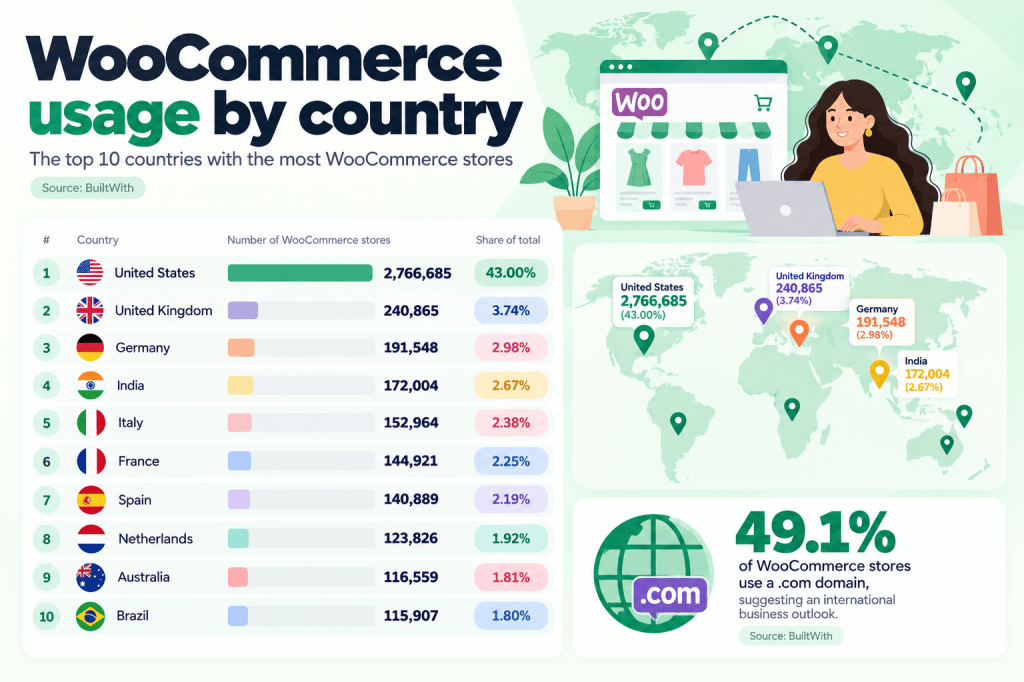
Here are the top stats on WooCommerce usage by country [BuiltWith]:
- The top 3 countries that use WooCommerce are the United States, the United Kingdom, and Germany.
- 2,766,685 (43.00%) stores are based in the United States, 240,865 (3.74%) in the United Kingdom, and 191,548 (2.98%) in Germany.
- India accounts for the 4th-largest share of WooCommerce stores at 172,004 (2.67%).
- The remaining top 10 markets include Italy (152,964, representing 2.38%), France (144,921, representing 2.25%), Spain (140,889, representing 2.19%), the Netherlands (123,826, representing 1.92%), Australia (116,559, representing 1.81%), and Brazil (115,907, representing 1.80%).
- 49.1% of WooCommerce stores use a .com domain, suggesting an international business outlook.
WooCommerce revenue and sales statistics
Finding accurate WooCommerce sales and revenue data was a challenge as WooCommerce and Automattic don’t collate it. And although some stats roundups quote $30–35 billion, they didn’t trace the figure back to a credible primary source.
The best order-level data available comes from Metorik. Its 2026 report was built from over 65 million orders totaling more than $6.6 billion in revenue, placed in 2025 across a randomized sample of 6,000+ stores.
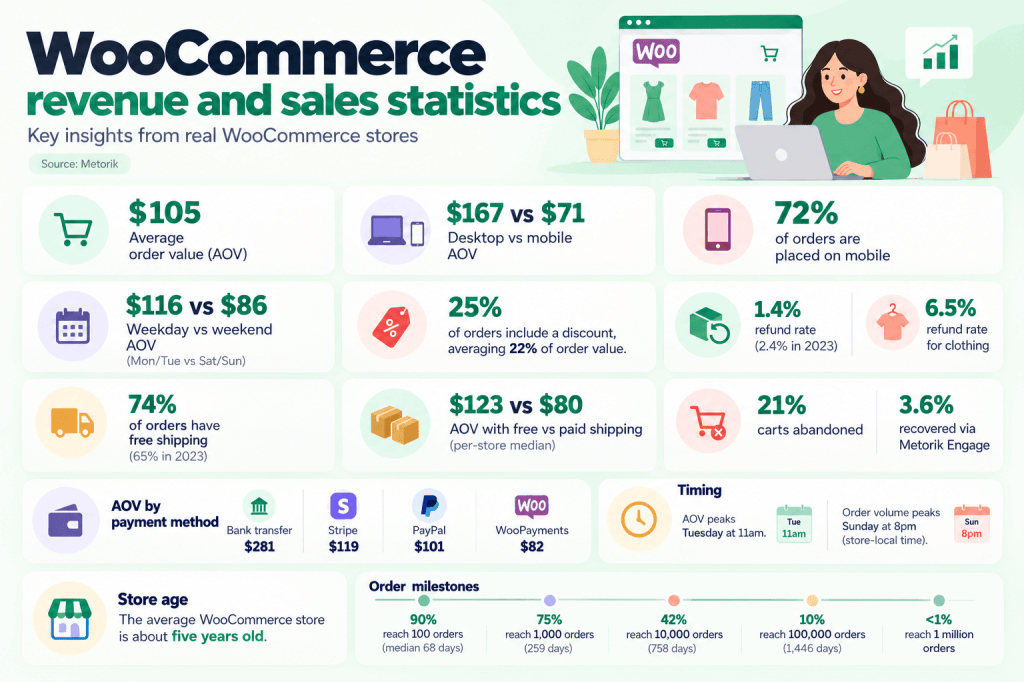
Here are the WooCommerce revenue and sales statistics according to Metorik:
| Metric | Stat |
| Average order value | $105 |
| Desktop vs mobile AOV | $167 vs $71 |
| Share of orders placed on mobile | 72% |
| Weekday vs weekend AOV | $116 (Mon/Tue) vs $86 |
| Orders that include a discount | 25%, averaging 22% of order value |
| Refund rate | 1.4% (2.4% in 2023); clothing 6.5% |
| Orders with free shipping | 74% (65% in 2023) |
| AOV with free vs paid shipping | $123 vs $80 (per-store median) |
| Carts abandoned | 21%; 3.6% recovered via Metorik Engage |
| AOV by payment method | Bank transfer $281, Stripe $119, PayPal $101, WooPayments $82 |
A few more Metorik benchmarks:
- Timing: AOV peaks Tuesday at 11am. Order volume peaks Sunday at 8pm (store-local time).
- Store age: The average WooCommerce store is about five years old.
- Order milestones: 90% of WooCommerce stores reach 100 orders (median 68 days), 75% reach 1,000 (259 days), 42% reach 10,000 (758 days). 10% reach 100,000 (1,446 days), Under 1% reach 1 million.
WooCommerce industry statistics
WooCommerce stores span a wide range of product categories, which illustrates its flexibility and versatility.
Home and Garden ranks as the most common. Apparel, business, and other categories make up meaningful portions of the ecosystem.
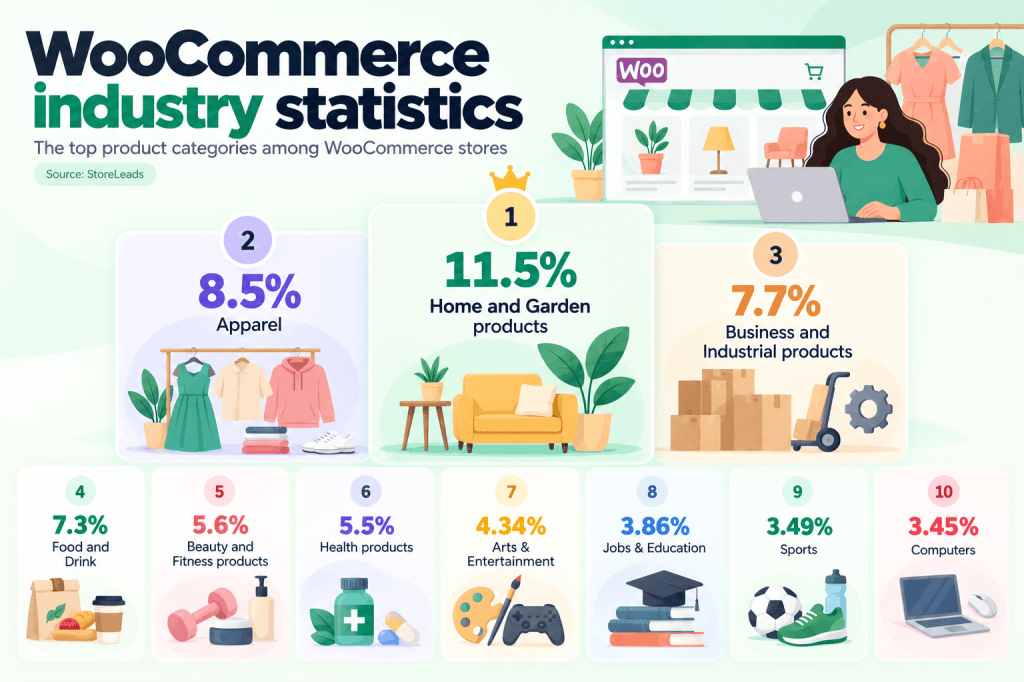
Here’s a detailed categorization of WooCommerce stores by what they sell:
- The top 3 categories of WooCommerce stores are Home and Garden products (11.5%), Apparel (8.5%), and Business and Industrial products (7.7%).
- Categories 4 to 10 comprise Food and Drink (7.3%), Beauty and Fitness products (5.6%), Health products (5.5%), Arts & Entertainment (4.34%), Jobs & Education (3.86%), Sports (3.49%), and Computers (3.45%).
The most popular WooCommerce themes
Astra is the most widely used theme, followed by Hello Elementor and Flatsome. Together, these three themes account for a substantial portion of the identified WooCommerce theme installations.
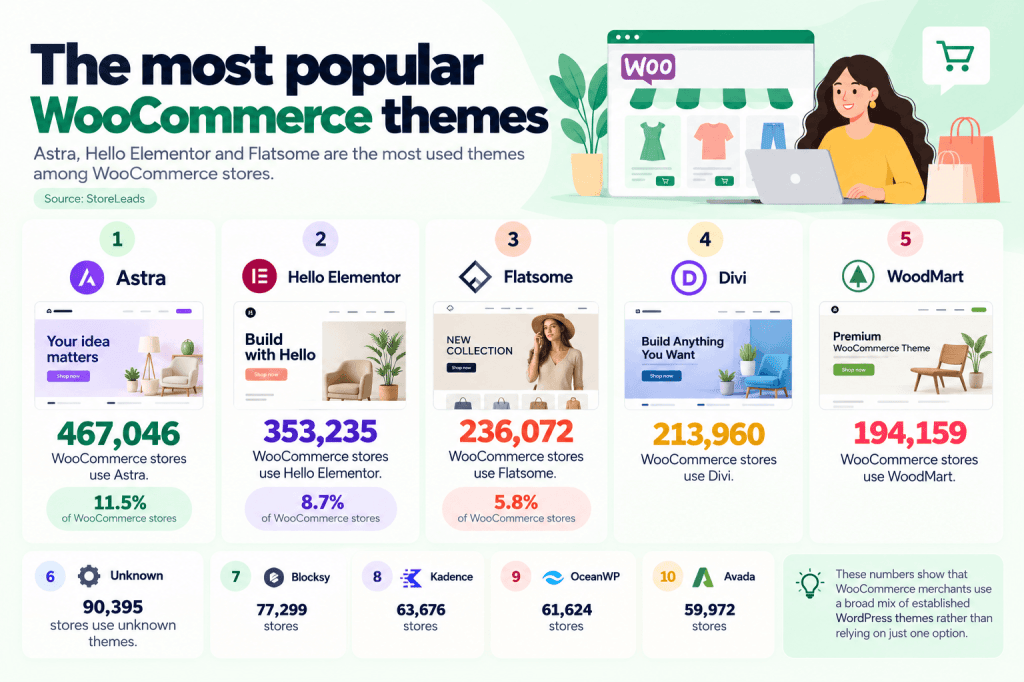
Here’s a breakdown of the numbers:
- 467,046 WooCommerce stores (11.5%) use Astra.
- Hello Elementor is used by 353,235 stores (8.7%).
- 236,072 stores (5.8%) use Flatsome.
- Divi is used by 213,960 WooCommerce stores.
- WoodMart is used by 194,159 WooCommerce stores.
- 90,395 stores use unknown WooCommerce themes.
The list also includes themes such as Blocksy (77,299 stores), Kadence (63,676 stores), OceanWP (61,624 stores), and Avada (59,972 stores). This shows that WooCommerce merchants use a broad mix of established WordPress themes rather than relying on just one option.
WooCommerce ecosystem statistics
WooCommerce’s sprawling ecosystem is a major reason merchants stay on the platform.
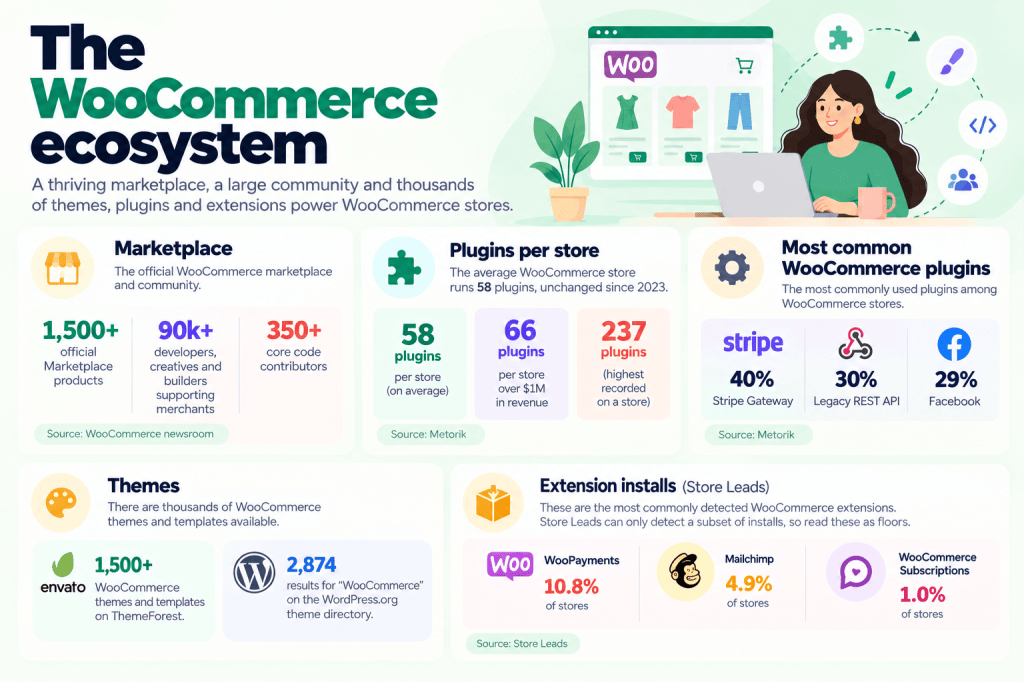
Here’s a glimpse into the WooCommerce ecosystem:
- Marketplace: WooCommerce cites 1,500+ official Marketplace products, 90k+ developers, creatives and builders supporting merchants, and 350+ core code contributors.
- Core development: WooCommerce 11.0 (August 4, 2026) included 551 pull requests from 89 contributors. Release 11.1 (September 1) had 561 PRs from 77 contributors. WooCommerce Developer
- Plugins per store: The average WooCommerce store runs 58 plugins, unchanged since 2023. Stores over $1M average 66, and one store ran 237. Metorik
- Most common WooCommerce plugins: Stripe Gateway (40%), Legacy REST API (30%), and Facebook (29%).
- Themes: ThemeForest lists 1,500+ WooCommerce themes and templates. Running a “WooCommerce” search on the WordPress.org theme directory returns 2,874 results.
- Extension installs: WooPayments on 10.8% of stores, Mailchimp on 4.9% and WooCommerce Subscriptions on 1.0%. Store Leads can only detect a subset of installs, so read these as floors.
New to WooCommerce? Our in-depth WooCommerce tutorial for beginners walks through the setup (with screenshots where necessary).
WooCommerce vs other platforms stats
WooCommerce vs Shopify statistics: growth, market share, sales and revenue
Shopify’s GMV is a company-reported figure that includes shipping, duties, and VAT. As an open-source platform, WooCommerce doesn’t track equivalent metrics, making direct comparisons challenging.
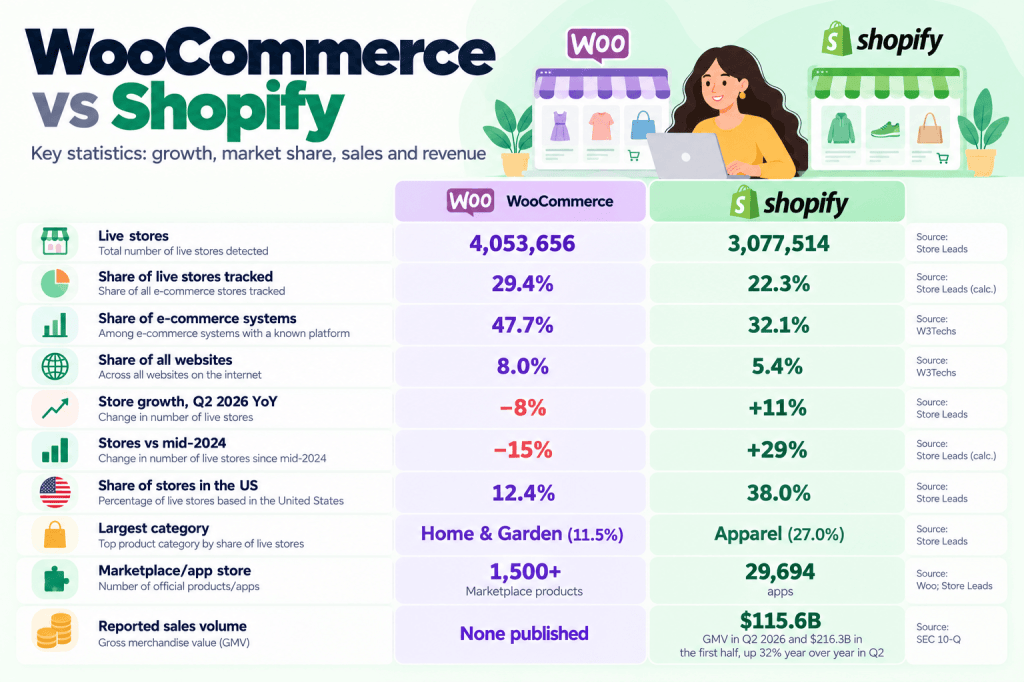
The table below compares key WooCommerce and Shopify statistics for 2025–2026, including store count, market share, growth, geography, ecosystem size, and reported sales volume.
| Metric | WooCommerce | Shopify | Source |
| Live stores | 4,053,656 | 3,077,514 | Store Leads |
| Share of live stores tracked | 29.4% | 22.3% | Store Leads |
| Share of e-commerce systems | 47.7% | 32.1% | W3Techs |
| Share of all websites | 8.0% | 5.4% | W3Techs |
| Store growth, Q2 2026 YoY | −8% | +11% | Store Leads |
| Stores vs mid-2024 | −15% | +29% | Store Leads |
| Share of stores in the US | 12.4% | 38.0% | Store Leads |
| Largest category | Home & Garden (11.5%) | Apparel (27.0%) | Store Leads |
| Marketplace/app store | 1,500+ products | 29,694 apps | WooCommerce Newsroom; Store Leads |
| Reported sales volume | None published | $115.6B GMV in Q2 2026 and $216.3B in the first half, up 32% year over year in Q2 | SEC 10-Q |
WooCommerce vs Shopify site performance statistics
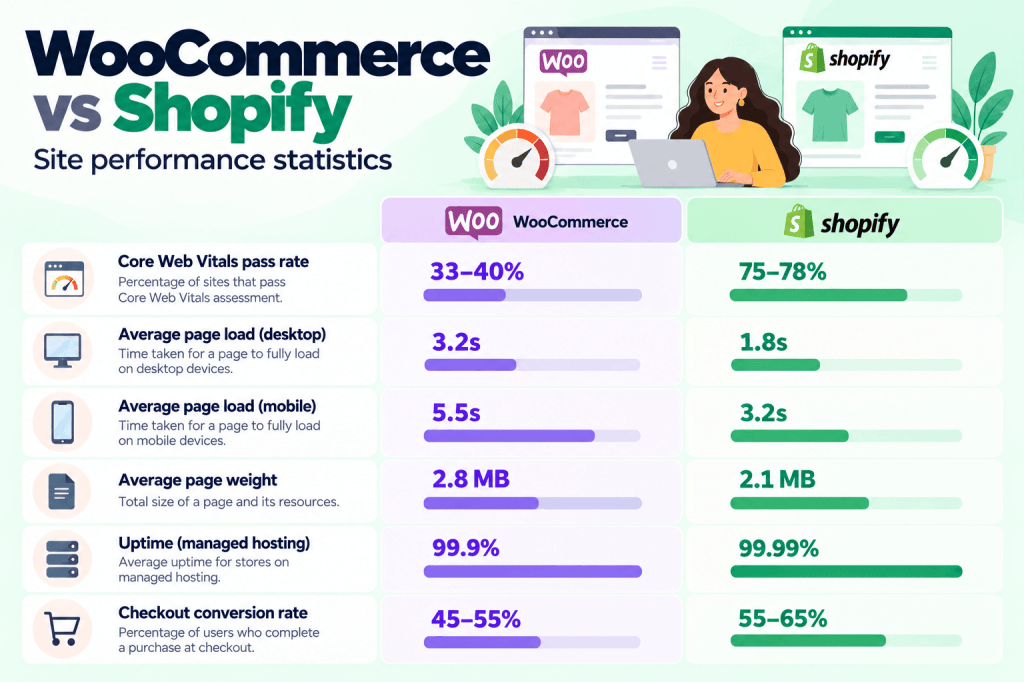
WooCommerce scores lower than Shopify on Core Web Vitals pass rate, likely due to varied web hosting providers and excessive plugin usage.
According to Shopify, Shopify stores record a slightly higher checkout conversion rate than WooCommerce, due to Shop Pay.
| Metric | WooCommerce | Shopify |
| Core Web Vitals pass rate | 33-40% | 75-78% |
| Average page load (desktop) | 3.2s | 1.8s |
| Average page load (mobile) | 5.5s | 3.2s |
| Average page weight | 2.8 MB | 2.1 MB |
| Uptime (managed hosting) | 99.9% | 99.99% |
| Checkout conversion rate | 45-55% | 55-65% |
WooCommerce vs Shopify vs BigCommerce statistics
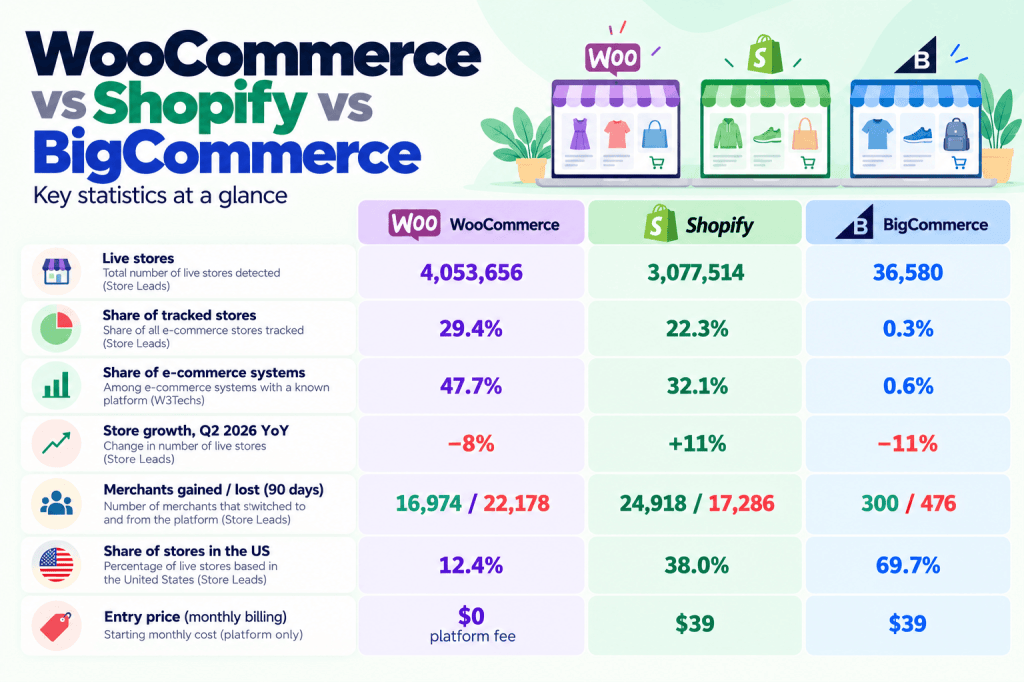
BigCommerce is another established ecommerce platform. The WooCommerce vs Shopify vs BigCommerce statistics below show how the three platforms compare across store count, market share, growth, migration, geography, and pricing.
| Metric | WooCommerce | Shopify | BigCommerce |
| Live stores (Store Leads) | 4,053,656 | 3,077,514 | 36,580 |
| Share of tracked stores | 29.4% | 22.3% | 0.3% |
| Share of e-commerce systems (W3Techs) | 47.7% | 32.1% | 0.6% |
| Store growth, Q2 2026 YoY | −8% | +11% | −11% |
| Merchants gained / lost (90 days) | 16,974 / 22,178 | 24,918 / 17,286 | 300 / 476 |
| Share of stores in the US | 12.4% | 38.0% | 69.7% |
| Entry price (monthly billing) | $0 platform fee | $39 | $39 |
What is the future of WooCommerce (growth prospects, trends, etc)?
WooCommerce faces real competition from Shopify. Migration data shows more merchants leaving WooCommerce than moving to it. Meanwhile, Shopify has continued to add stores during the same period.
However, this doesn’t make the future of WooCommerce a foregone conclusion.
The exact figures vary by source, but the broader WooCommerce usage trend is clear: the platform operates in a more competitive and mature ecommerce market than it did a few years ago.
Looking at WooCommerce market share statistics from 2025 and 2026 alongside store growth and migration data gives a more useful picture than relying on any single market-share figure.
WooCommerce’s open-source foundation, lower cost of ownership, large developer ecosystem, extensive extension marketplace, and ability to customize the underlying store infrastructure continue to make it a fit for businesses that want greater control over their ecommerce stack.
Platform-wide statistics only tell part of the story. If you want to understand how visitors actually interact with your WooCommerce store, the Dotstore Enhanced Ecommerce Google Analytics for WooCommerce plugin can help. It connects your site to Google Analytics so you can track the entire customer journey from product views and add-to-cart events through checkout and purchase. This empowers you to better understand how visitors interact with your store and identify opportunities to improve conversions.
WooCommerce Product Enhancements Plugins
Turn Shoppers into Loyal Customers with Product Enhancements
14-day, no-questions-asked money-back guarantee.